Using the Health Monitor Status to Determine Web Application Health
Using the Health Monitor Status to Determine Web Application Health
Health Monitoring Responses
The status monitors, such as Nagios,IPMonitor, or SolarWinds, and load balancers can use the health monitoring responses to check load balancer health and for monitoring application’s health. The health monitoring also helps to monitor the health and performance of the development infrastructure to prevent downtime. The load balancer status helps to understand the load balancer health with which infrastructure, networking, or IT Operations can make decisions to improve application performance, optimize resource use, and allow applications to scale horizontally while maintaining resilience.Load balancer status
Request
/status
or
/status/lb
Response
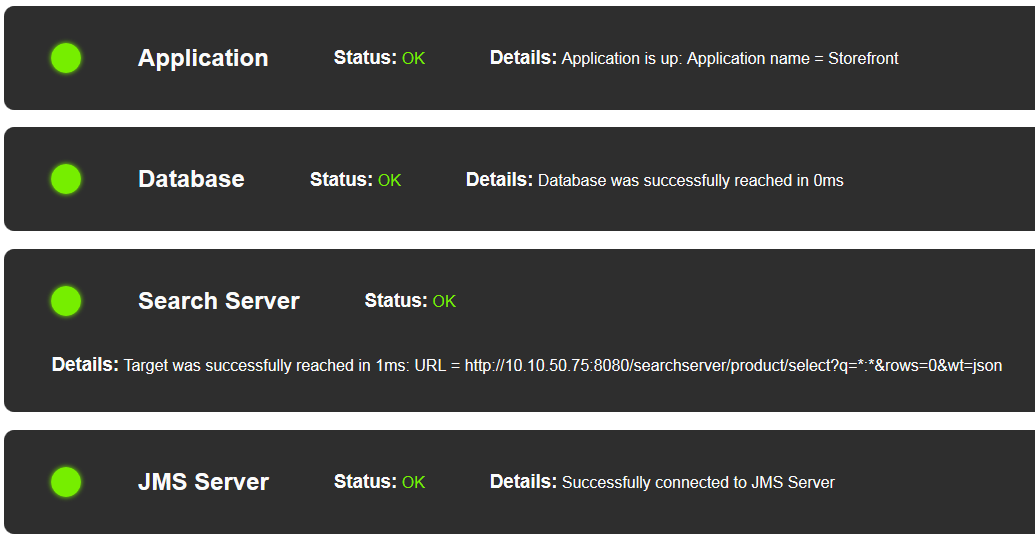
Status 200 is returned along with following HTML page:
OK

Application: OK Application is up: Application name = Storefront
Database: OK Database was successfully reached in 0ms
Search Server: OK Target was successfully reached in 2ms: URL = ...
JMS Server: OK Successfully connected to JMS Server
Error Response
Status 503 is returned if any of the load balancer status checks fail.
JSON Status
Request
/status/info.json
Responses
{"Application":{"status":"OK","info":"Application name = Storefront","message":"Application is up"},
 "Database":{"status":"OK","message":"Database was successfully reached in 0ms"},
 "Search Server":{"status":"OK","info":"URL = ...",
 "JMS Server":{"status":"OK","message":"Successfully connected to JMS Server"}}


