Query Analyzer Tool Usage
The ep-query-analyzer-0.0.0-SNAPSHOT.jar can be found under the </ep-commerce/commerce-engine/ep-query-analyzer/target folder.
The tool uses the trace lines that are found in <USER_HOME/ep/logs/ep-cortex.log>, or any other Elastic Path application log, enabled through a JMX connection to the Logback MBean or through log4j2.xml.
The following loggers provide the trace output:
openjpa
com.elasticpath.rest.resource.dispatch.operator.AnnotatedMethodDispatcher
com.elasticpath.rest.resource.dispatch.linker.ResourceLinker
com.elasticpath.rest.helix.runtime.server.PrototypeDispatcherResourceServer
All JPA classes, AnnotatedMethodDispatcher, ResourceLinker, and PrototypeDispatcherResourceServer classes provide trace output for Query Analyzer. The OpenJPA trace lines provide JPA and SQL statistics. The Cortex traces provide correlation between Cortex requests and JPA/DB queries, so that Cortex operation can report the database statistics.
For more information about the details provided, see Overview
The tool can be deployed as a bundle, within an OSGi container, or can run from the command line, as any other executable JAR. Regardless of the usage, only one JAR is created.
Command Line Usage
The command line tool can be useful when Cortex or any other application log already contains the required trace lines. In this case, the TRACE level needs to be manually enabled for the loggers mentioned previously, in the log4j2.xml file.
To use the tool from the command line, run the following command:
java -jar </ep-commerce/commerce-engine/ep-query-analyzer/target/ep-query-analyzer-0.0.0-SNAPSHOT.jar>
You can override the following default values using system properties:
-Dlog.file.path=<ABSOLUTE_PATH_TO_CORTEX_LOG>Specifies the default location of Cortex log file. The parser accesses the Cortex log file at this location if you set the location. If not, parser reads the default Cortex log file,
USER_HOME/ep/logs/ep-cortex.log.
java -Dlog.file.path=<ABSOLUTE_PATH_TO_CORTEX_LOG> -jar </ep-commerce/commerce-engine/ep-query-analyzer/target/ep-query-analyzer-0.0.0-SNAPSHOT.jar>
-Dprint.json.to.console.onlyDisplays JSON output only in console.
If this property is set to any, non-empty, value, such as
-Dprint.json.to.console.only=Xor-Dprint.json.to.console.only=EP, the system displays the JSON output only in the console and does not save the output to a file irrespective of the value.-Doutput.json.file.pathSaves the output in an external file at the specified path. By default, the output is saved at
USER_HOME/cortex_db_statistics.json
All system properties are defined in the com.elasticpath.repo.performancetools.queryanalyzer.utils.SystemProperties module.
OSGi Bundle Usage
If the tool is deployed as an OSGi bundle, ensure that the Cortex application is started with JMX support enabled.
The JMX support can be enabled using the following system properties:
-Dcom.sun.management.jmxremote
-Dcom.sun.management.jmxremote.port=<PORT>
-Dcom.sun.management.jmxremote.ssl=false
-Dcom.sun.management.jmxremote.authenticate=false
Where PORT is the port number, for example 6969. When you start Cortex using Maven, add the parameters to the MAVEN_OPTS environment variable.
Otherwise, modify the environment variable that contains the system properties, such as, CATALINA_OPTS.
For Windows, open command prompt and run the following:
set MAVEN_OPTS=%MAVEN_OPTS% -Dcom.sun.management.jmxremote -Dcom.sun.management.jmxremote.port=6969 -Dcom.sun.management.jmxremote.ssl=false -Dcom.sun.management.jmxremote.authenticate=falseFor Linux/Mac, start a terminal and run the following:
export MAVEN_OPTS="$MAVEN_OPTS -Dcom.sun.management.jmxremote -Dcom.sun.management.jmxremote.port=6969 -Dcom.sun.management.jmxremote.ssl=false -Dcom.sun.management.jmxremote.authenticate=false"
This enables remote JMX connections, so that Cortex can configure logging as required. The above settings are only temporary and valid for the current command prompt/terminal window. It is a good practice to make the settings permanent.
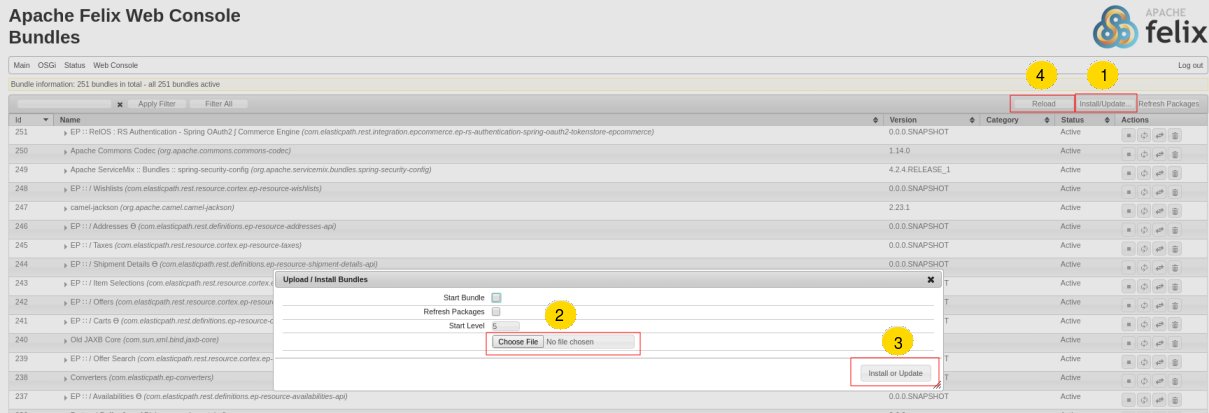
To use the tool as an OSGi bundle, follow these steps:
Access the Felix console through
http://localhost:<CORTEX_PORT>/cortex/system/console/bundles.note
The login is admin/admin. The default CORTEX_PORT is 9080.
Click
Install\Update(1). .
.Select the
/ep-commerce/commerce-engine/ep-query-analyzer/target/ep-query-analyzer-0.0.0-SNAPSHOT.jarfile (2).Click
Install or Update(3).If the
Query Analyzeris not visible, reload the bundles (4) and order the bundles by ID in the descending order by clicking on the ID column.The
Query Analyzerbundle will appear on the top and will not be started by default.Prepare the Cortex request, such as through Postman or Studio, but do not execute it.
Click
Start(5).The tool is ready for logging, the main
ep-cortex.logfile is cleaned and other logs deleted to avoid noise from previous requests.
Run the request.
Click
Stopbutton (6).The tool parses all Cortex logs, however, there could be one or more logs created

Open
USER_HOME/cortex_db_statistics.jsonfile in a text editor.
