Performance Insights for Cucumber Tests
Overview
Self-Managed Commerce relies on JPA managed database operations that cause performance issues due to the sheer volume. With the Performance Insights for Cucumber Tests tool, you can now discover these performance issues during early development, focusing only on the database operations.
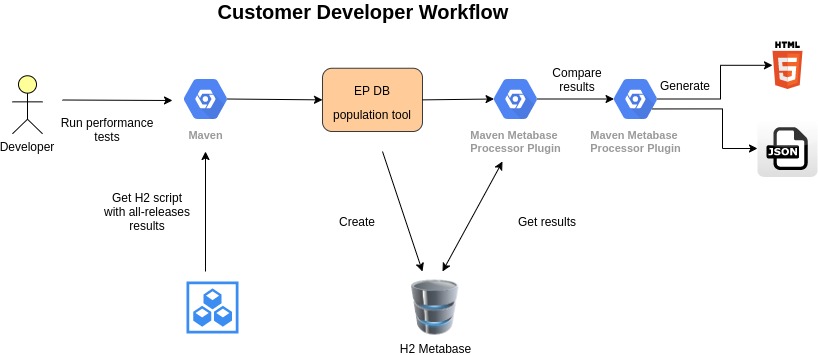
Performance Insights for Cucumber Tests tool provides an easy and reliable way to discover performance issues during early development, focusing only on the database operations. The tool executes a set of Cucumber tests that run through various code paths to measure the number of database operations. Database operations are measured using Elastic Path’s Database Query Analyzer Tool, which is used for database profiling and investigation of the performance issues. The results of the tests are available in CSV, JSON, and HTML formats.
note
Invoke this tool from a developer’s local environment only.
Executing the Tool
Do the following to verify the performance of project customizations against the specified release version:
Open the terminal and change the directory to the
extensions/system-tests/performance-tests/cucumberfolder in yourep-commercesource code folder.Run the following command:
mvn clean install -Prun-performance-tests,compare-with-imported-metabase -Depc.version=8.3.xTo specify a different release version, modify the
-Depc.version=<EPC_VERSION>system property on the command line.
The Maven profiles for this command are:
run-performance-tests: Runs all performance tests and creates JSON reports.compare-with-imported-metabase: Compares current results with the specified out of the box release version using the imported metabase data and generates a full HTML report.

Reports
The tool generates two types of reports:
- JSON reports: The
run-performance-testsMaven profile generates the JSON report and contains detailed information about database calls. Use a JSON-friendly viewer with search capabilities to view the report. - HTML reports: The
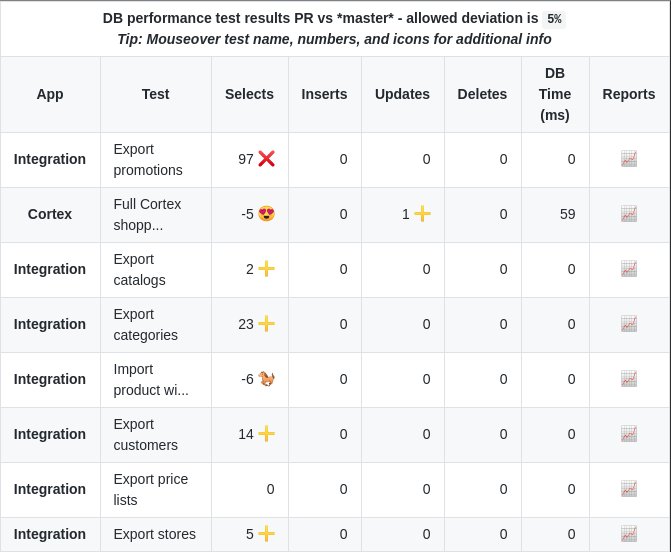
compare-with-imported-metabaseMaven profile generates the HTML report that contains the summary information including current results with the specified out of the box release version using the imported metabase data.

Emojis
The emojis used in the GitHub comment report ares:
| Emoji | Comments |
|---|---|
 | Indicates performance degradation. |
 | Indicates an increase, within an acceptable deviation (5%). |
 | Indicates a new test. |
| Indicates a local JSON report. |
If the local and out of the box performance results are the same, no emoji is displayed. The results are ordered by the failures first and then by the application name. Hover over the results to view the additional information provided in the tooltips.
Adding Additional Tests
All performance tests are based on the Cucumber framework. You can add new tests to the extensions/system-tests/performance-tests/cucumber folder.
Ensure that the tests that you write meets the following conditions:
- The step is clear about what is tested.
- The step asserts the expected result, such as HTTP status.
- The scenario name must not contain commas or single quotes.
note
If you rename an existing test that is already in the metabase, the history of that test is affected.
Whenever you add a new functionality or update an existing one:
- Run all tests, without changing the code, and check for variability in all database counters.
- Ensure that the tests produce a constant number per counter.
- In case of variability, identify and rectify the root cause and repeat the tests until you get the constant counter.
