Health Monitoring Tool Usage
Determine Web Application Health
The status monitors, such as Nagios, IPMonitor, or SolarWinds, and load balancers can use the health monitoring responses to check load balancer health and for monitoring application’s health.
The health monitoring also helps to monitor the health and performance of the development infrastructure to prevent downtime. The load balancer status helps to understand the load balancer health with which infrastructure, networking, or IT Operations can make decisions to improve application performance, optimize resource use, and allow applications to scale horizontally while maintaining resilience.
The Health Monitoring provides the following types of responses depending on the request URL:
- Load balancer status: For load balancer health check
- JSON status: For status monitoring applications
- HTML status: For human access
Load balancer status
Example request can be one of the following two
/status
Or
/status/lb
Example success response:
Status 200 is returned along with following HTML page:
OK

Application: OK Application is up: Application name = Storefront
Database: OK Database was successfully reached in 0ms
Search Server: OK Target was successfully reached in 2ms: URL = ...
JMS Server: OK Successfully connected to JMS Server
Example failure/error response:
Status 503 is returned if any of the load balancer status checks fail.
JSON Status
Example request:
/status/info.json
Example response:
{"Application":{"status":"OK","info":"Application name = Storefront","message":"Application is up"},
 "Database":{"status":"OK","message":"Database was successfully reached in 0ms"},
 "Search Server":{"status":"OK","info":"URL = ...",
 "JMS Server":{"status":"OK","message":"Successfully connected to JMS Server"}}
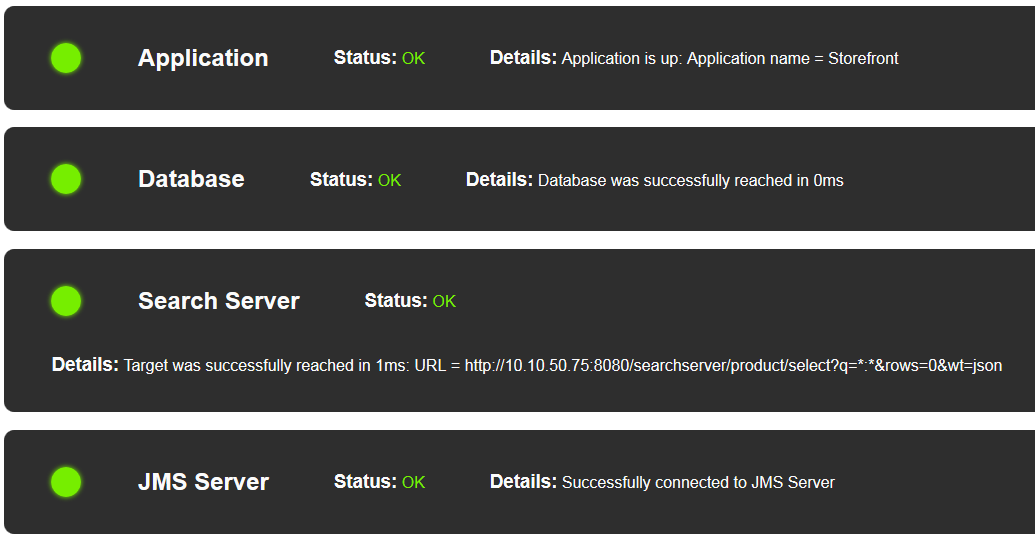
HTML Status
Example request:
/status/info.html
Example response:

Adding Health Monitor to a New Webapp
You can add health monitor to a new Elastic Path webapp to use health monitor for consistency with the other Elastic Path applications in their environments.
For example, you might want to add a new webapp to simulate an ESB (Enterprise Service Bus) in environments where a proper ESB is not available or to isolate custom, non-commerce development modules from the Elastic Path platform.
Add the following status checker servlet to your web.xml at ep-commerce/health-monitoring/ep-health-monitoring-webapp/src/main/webapp/WEB-INF/:
<!-- Health Monitoring servlet -->
<servlet>
    <servlet-name>Status servlet</servlet-name>
    <servlet-class>com.elasticpath.health.monitoring.servlet.StatusCheckerServlet</servlet-class>
</servlet>

<servlet-mapping>
  <servlet-name>Status servlet</servlet-name>
  <url-pattern>/status/*</url-pattern>
</servlet-mapping>
Adding Webapp Specific Configuration
Define the webapp specific configuration in the
epmonitoring.xmlfile.Specify the following status check lists that you want performed for the webapp:
loadBalancerStatusCheckerTargetList: Contains the verification activities that must be performed when a load balancer requests the webapp statusadditionalInfoStatusCheckerTargetList: Contains additional verifications that are useful for human diagnostic purposes
To configure the refresh interval for the HTML status page, add the
healthMonitoringRefreshIntervalSecondsbean class as in the following example:<!-- Refresh interval for HTML status --> <bean id="healthMonitoringRefreshIntervalSeconds" class="java.lang.Integer"> <constructor-arg value="5" /> </bean>The default value is 10 seconds.
To allow access to the configured status check URLs, update the
web.xmlas required.
